|
Search Site Guidelines at Diagnosis | About Clinical Trials How to Help! |
|
|
Patients Against Lymphoma |
|
|
|
|
|
(60%)
|
||||||||||||||||||||||||||||||||||||||||||||||||||||||||||||||||||||||||||||||||||||||||||||||||||||||||||||||||||||||||||||||||||||||||||||||||||||||||||||||||||||||||||||||||||||||||||||||||||||||||||||||||||||||||||||||||||||||||||||||||||||
Also see Prognostic Indicators and Jay Gould's
|
Median age at diagnosis for lymphoma:
for Non-Hodgkin's lymphoma: 67 yrs of age;
for Hodgkin's: 37 yrs of age
Source: seer.cancer.gov pdfPrevalence of lymphoma:
"This includes any person alive on January 1, 2007 who had been diagnosed with Hodgkin lymphoma at any point prior to January 1, 2007 and includes persons with active disease and those who are cured of their disease."
Non-Hodgkins: "On January 1, 2007, in the United States there were approximately 438,325 men and women alive who had a history of non-Hodgkin lymphoma -- 226,855 men and 211,470 women. SEER
Hodgkins: "On January 1, 2007, in the United States there were approximately 164,273 men and women alive who had a history of Hodgkin lymphoma -- 84,583 men and 79,690 women. " SEER
CLL/ SLL: "101,374" SEER
Changing prevalence of indolent lymphoid malignancies among the elderly ASCO 2006
Background: Reported changes in incidence rates and improved survival rates among patients with common indolent B-cell lymphoid malignancies have potential implications for increased disease burden among the elderly.
Conclusions: Increased FL incidence and increased survival rates have resulted in a growing disease burden among the elderly over the last decade; the prevalence of CLL/SLL has remained static.Follicular lymphoma: median survival for different molecular subtypes
"Individual genes that predicted the length of survival were grouped into gene-expression signatures on the basis of their expression in the training set, and two such signatures were used to construct a survival predictor. The two signatures allowed patients with specimens in the test set to be divided into four quartiles with widely disparate median lengths of survival (13.6, 11.1, 10.8, and 3.9 years), independently of clinical prognostic variables. Flow cytometry showed that these signatures reflected gene expression by nonmalignant tumor-infiltrating immune cells. " NEJM.org
Good News: Improved survival of follicular lymphoma patients in the surveillance,
epidemiology, and end-results (SEER) program. ASCO 2004 ~ Abstract No: 6578Costs not shown in statistics
The physical and emotional pain, the side effects of repeated treatment, the decreased ability to be productive, the loss of income and life goals, the stress on family and loved ones, and the reduced ability to contribute fully to our communities.
"Not every thing that counts, can be counted;
not everything that can be counted counts" ~ Albert Einstein
Incidence | Prevalence | Mortality | Treatment |
Causes of Death | Lifetime Risk Blood Cancers
|
Non-Hodgkin's Lymphoma is the second fastest rising cancer in incidence and death rates in the United States. |
|
|
"Lymphoma is increasing faster than any other cancer except melanoma. Unlike melanoma, which can be |
|
|
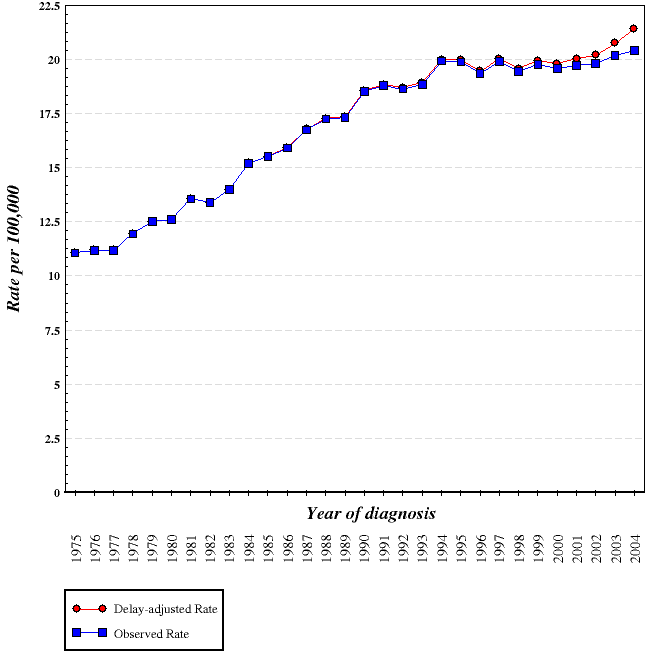
Epidemic growth: There has been a 2-fold rise in incidence rate (8/100,000 to 16/100,000) between 1973 and 1995, and has increased 4% annually. The increase, however, has leveled off in the last five years. |
|
|
Each day approximately 170 Americans are diagnosed with lymphoma. |
|
|
In 2003, it’s estimated that 61,000 new cases of lymphoma will be diagnosed. |
|
|
Comparing incidence and mortality of NHL in geographic areas - other countries - |
|
Approximately 500,000 people in the United States are living with Lymphoma. |
|
|
Lymphoma is the most commonly occurring blood cancer, and is the third most common childhood cancer. |
|
|
Generally, the shorter the survival the lower the prevalence in relation to incidence. For lymphoma the ratio of incidence (61,000) to prevalence (500,000) indicates that treatment is effective |
|
Each year, approximately 27,600 deaths are attributed to lymphoma. |
|
|
Each day, approximately 75 people die of the lymphoma. |
|
|
The five-year relative survival rate for non-Hodgkin's lymphoma patients has |
|
Approximately 45% of patients with aggressive non-Hodgkin’s lymphomas can be cured with standard treatments, and almost all indolent lymphomas remain incurable, unless diagnosed early and treated with radiotherapy when the disease is localized. |
|
|
Approximately 50% of patients with stage I indolent follicular lymphoma, and one quarter with stage II disease, can be cured with radiotherapy. |
|
|
We have calculated that approximately 37% of Lymphomas are curable with standard therapies. |
|
|
The less-common Hodgkin’s lymphoma is curable about 80% of the time. |
|
|
* The aggressive type of NHL has a shorter natural history, but approximately 40-50% of patients can be cured with combination chemotherapy. |
|
|
** Current estimates of median survival for indolent follicular lymphoma, the most common form of NHL, range from 8 to 10 years. Approximately 50% of patients with stage I indolent follicular lymphoma, and one quarter with stage II disease, can be cured with radiotherapy, but the overwhelming majority of patients are diagnosed with advanced disease. |
|
Ten-year survey of incidence of infection as a cause of death in hematologic malignancies: study of 90 autopsied cases. Acta Haematol. 1995;93(1):25-30. PMID: 7725846 | Related articles |
|
|
Causes of death in children diagnosed with non-Hodgkin's lymphoma between 1974 and 1985. |
|
Race |
Men | Women | ||||||||
| NHL | HD | Leukemia | CLL | MM | NHL | HD | Leukemia | CLL | MM | |
| All races | 2.18 | 0.24 | 1.50 | 0.53 | 0.70 | 1.82 | 0.19 | 1.07 | 0.33 | 0.55 |
| White | 2.32 | 0.25 | 1.61 | 0.59 | 0.68 | 1.94 | 0.21 | 1.14 | 0.35 | 0.51 |
| Blacks | 1.25 | 0.21 | 0.87 | 0.26 | 0.97 | 1.06 | 0.15 | 0.79 | 0.20 | 0.93 |
Source: SEER CSR report 1975-2002
NOTE: For blood cancers, risk are generally higher in white men. A notable exception to the risk of Multiple myeloma in black men and women.
Comparing age-adjusted incidence rates:
Leukemias: 12.3 per 100,000 men and women per year * Lifetime risk:
Lymphomas: 22.0 per 100,000 men and women per year.*** http://seer.cancer.gov/statfacts/html/leuks.html?statfacts_page=leuks.html&x=9&y=19
** http://seer.cancer.gov/statfacts/html/lymph.html?statfacts_page=lymph.html&x=16&y=17"It is estimated that 44,240 men and women (24,800 men and 19,440 women) will be diagnosed with and 21,790 men and women will die of leukemia in 2007"
"It is estimated that 71,380 men and women (38,670 men and 32,710 women) will be diagnosed with and 19,730 men and women will die of lymphoma in 2007"
NOTE: CLL is classified by SEER as a leukemia, but many experts consider it a lymphoma.
County-based statistics - dsf.health.state.pa.us/ |
|
"The incidence rate of non-Hodgkin’s lymphoma increased by 76% for males and 49% for females between 1975 and 1994. |
|
|
The mortality rate of non-Hodgkin’s lymphoma has steadily increased for males (19%) and females (17%) over the same period." - Roswell Park Cancer Inst. |
|
|
New York State Cancer Registry - health.state.ny.us/nysdoh |
|
"The study also found statistically significant elevations of 10 to 55% in the incidence of the following cancers on Staten Island as a whole: pharynx, colon, lung, bladder, larynx in men; and pharynx, colon, lung, breast, bladder, lymphoma in women." |
|
|
New York State Cancer Registry – Staten Island (Richmond) - Health.state.ny.us/nysdoh |
For more information, see - Incidence of Lymphoma in Staten Island & New York City

"The magnitude of the human and economic costs of cancer in the United States is enormous. At current rates, invasive cancer will be diagnosed in approximately 1 of every 2 American men and 1 in 3 women in their lifetimes. Cancer afflicts 2 out of every 3 families. The annual costs of cancer are estimated at about $107 billion—37 billion for direct medical costs, $11 billion for lost productivity, and $59 billion for indirect mortality costs." ~ cancer.org pdf
SEER Fast Stats - NHL | Hodgkin's (highly recommended) |
|
SEER CSR Report - seer.cancer.gov pdf |
|
Search SEER Cancer Statistics Review, 1975-2000 - SEER.cancer.gov
|
|
Changing incidence of non-Hodgkin lymphomas in the United States.
|
|
Non-Hodgkin's Lymphoma: U.S. Racial/Ethnic Cancer Patterns - Cancer.gov |
|
SEER NHL Statistics (Cyberfamily) - PDF | PDF-Help |
|
Cancer Facts and Figures 2002-1997 - ACS |
|
Cancer Incidence and Mortality - edcenter.med.cornell.edu |
|
SEER, about: "The Surveillance, Epidemiology, and End Results (SEER) Program of the National Cancer Institute is the most authoritative source of information on cancer incidence and survival in the United States." |
|
SEER databases - NCI |
|
Cancer Trends - Dr. Richard Klausner, Director of the NCI, 2001 |
|
Statistics Definitions - SEER |
View/Download Maps for Non-Hodgkin's Lymphoma - NCI | Summary text |
|
The U.S. government released its first state-by-state report on cancer
|
|
Pop-chart ~ Select Cancer type to compare mortality by States - NCI |
Blood Cancers Facts and Statistics - LLS |
|
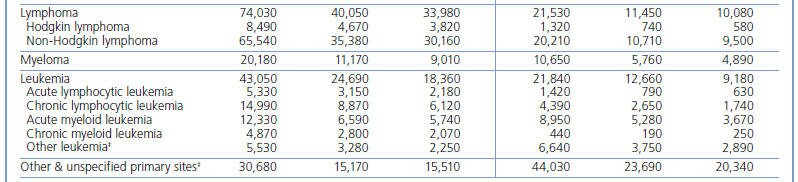
"An estimated 109,500 people in the United States will be diagnosed with leukemia, lymphoma, and myeloma this year. |
|
New cases of leukemia, lymphoma, and myeloma account for 8.6 percent of the 1,268,000 new cancer cases diagnosed in the United States in 2001. |
|
The total estimated number of blood-related cancers has increased only slightly for each of the past three years. |
|
Every five minutes, someone in the United States learns that they have leukemia, lymphoma, or myeloma, more than 300 people a day." - LLS |
OVERALL STATE OF THE SCIENCE
Excerpt from the Report of the Leukemia, Lymphoma, and Myeloma Progress Review Group May 2001 full text"Despite advances in diagnosis and treatment and improvements in patient survival, the hematologic cancers continue to have a significant impact on the lives of Americans.
Right now, almost 700,000 Americans are living with leukemia, lymphoma, or myeloma (LLM), and an estimated 100,000 new cases occur each year.
Although mortality has declined and 5-year survival rates have increased among adults and children with certain forms of these diseases, an estimated 60,000 Americans will die of them in 2001.
For all forms of leukemia, the five-year survival rate is only 46%, for non-Hodgkin's lymphoma it is 54.2%, and for multiple myeloma it is only 28%.
Despite the significant decline in the death rate for children with leukemia, this disease still causes more deaths in children in the U.S. than any other disease.
Furthermore, the death rates for non-Hodgkin's lymphoma and multiple myeloma are increasing at a time when death rates for other cancers are dropping.
Since the 1970's, incidence rates for non-Hodgkin's lymphoma have increased dramatically, making it one of the fastest rising cancers in the United States.
The hematologic cancers strike individuals of all ages, from children to the elderly; men and women; and all races." - LLMPRG report
COMMENT & QUESTIONS:
By including both indolent and aggressive NHL we are really combining two separate conditions, particularly when survival is considered, since aggressive is curable in maybe 40% of cases. This occurred to me yesterday in noting that SEER reports that about 29% are still alive after 20 years...but which ones?? Hopefully not JUST the 40% cured with aggressive, although mathematically they must comprise a large percentage. As time goes on we should try to distinguish more clearly the considerable differences between indolent and aggressive. In fact, it's too bad that our disorder is a NON something...especially since it vastly outnumbers Hodgkin's. This takes something away from the public profile of NHL...do people want to support a "non-something"? - Robert Miller.
Q: I have been diagnosed with Lymphoma Stage 4-Do you have any statistics as to the survival rate of patients with this diagnosis?
A: There is a saying in statistics that "the Median is *not* the message." Ever so true for lymphomas (emphasis on plural) in which there are so many subtypes of the disease and of the people diagnosed with it. Factors that predict the *average* survival for pts with lymphoma include the specific diagnosis, the stage of the disease (almost everyone is diagnosed with stage 4), the age and performance level of the patient, tumor burden, high LDH levels, response to initial treatment and the duration of the initial response ...
Also, survival data is always a few seasons behind and does not take into account the impact of newer more targeted treatment approaches that are available now, and of course the new treatments to arrive soon.
View/Download Maps for Non-Hodgkin's Lymphoma - NCI | Summary text |
|
Pesticides Research Report: Do Pesticides Cause Lymphoma? - LFA |
|
Non-Hodgkin's Lymphoma Incidence - Lymphoma Info Net |
|
Brief description of mortality figures and patterns between 1950 and 1994 - NCI |
|
Mortality Graphs and Maps - NCI |
|
Customized mortality Map - NCI
|
"A disturbing trend is that the incidence and mortality rates for NHL have increased, with the incidence rate nearly doubling, since the early 1970s, then stabilizing in the last 5 years. For both forms of lymphoma, incidence and mortality rates have been higher for whites than African Americans and other ethnic groups. It is estimated that, each year, $2.6 billion* is spent in the United States on treatment for lymphoma." 1